OptionFlys · High-Timeframe Market Maps

The Chart Room.
Read the bigger picture.

A working archive of Elliott Wave market maps, cycle structure, and major levels—updated when the higher-timeframe picture materially changes.

Not a daily alert feed. Not a prediction machine. The chart work that frames the market.

Current Market Maps

The market is bigger than one candle.

Each update is built around the higher-timeframe structure: where the cycle stands, what confirms the count, and what would invalidate it. These are the maps that give every shorter-term decision context.

Elliott Wave Roadmaps & Execution

Real analysis. Defined waves. Documented execution.

Examples of the Elliott Wave roadmaps, defined price levels, trade execution, and ongoing updates shared inside the OptionFlys community.

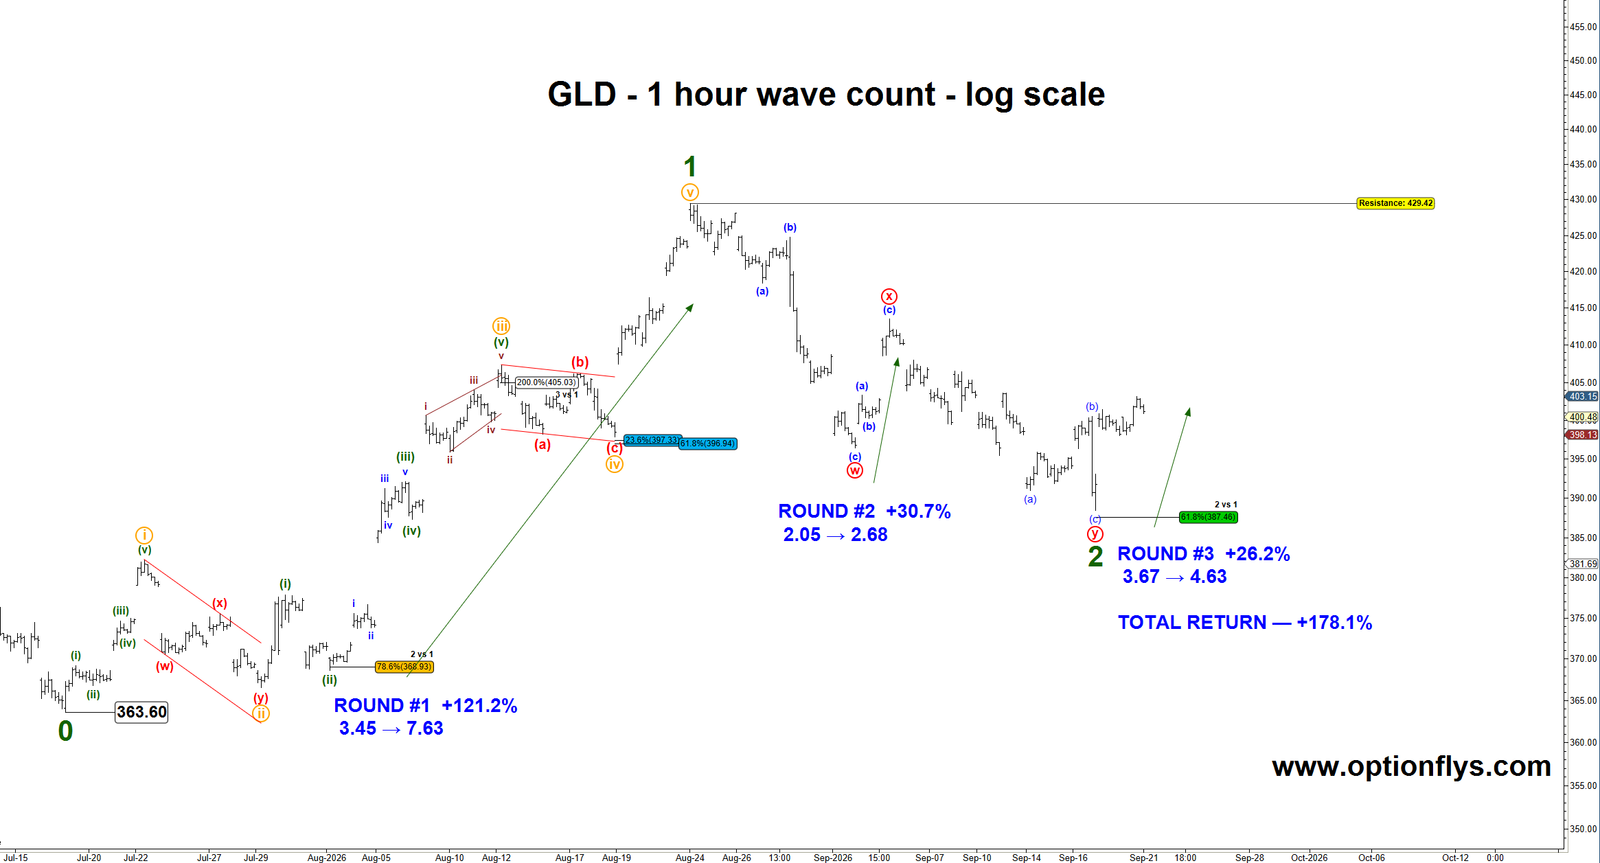
GLD one-hour Elliott Wave count showing three documented option trades
GLD · Elliott Wave · Trade Execution

GLD — Elliott Wave Count & Trade Execution

A real-world example of how we use Elliott Wave analysis with trade execution. Three separate option trades were executed as the GLD wave count developed.

Round #1: 3.45 → 7.63  |  +121.2%
Round #2: 2.05 → 2.68  |  +30.7%
Round #3: 3.67 → 4.63  |  +26.2%

Total of the three stated trade returns: +178.1%.

The wave count provides the roadmap. We follow the waves as price develops and execute when the setup confirms.
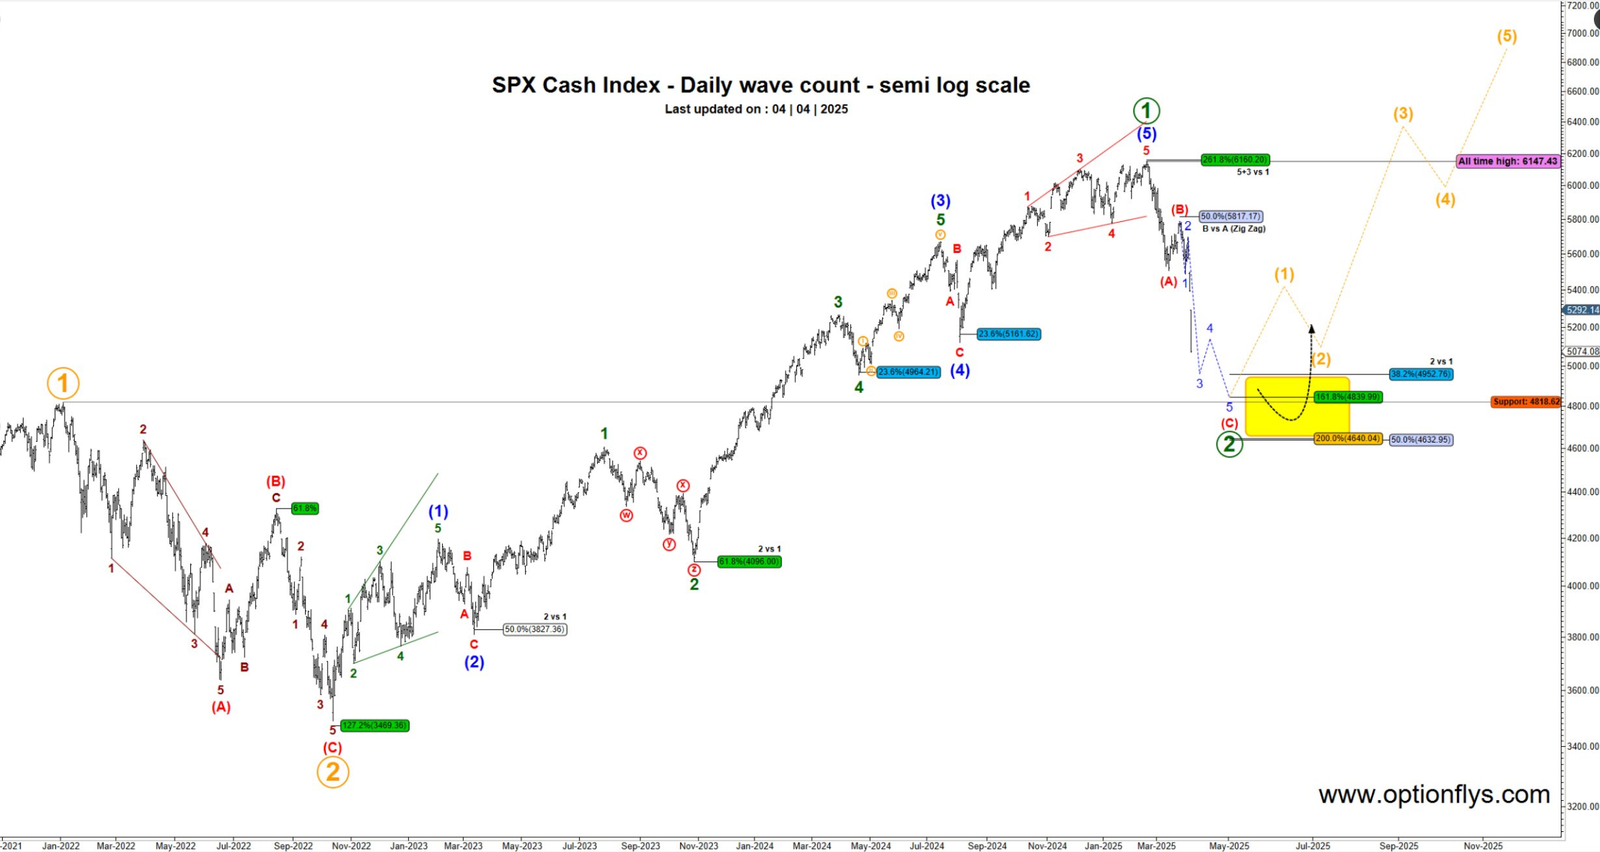
SPX Elliott Wave roadmap published April 4, 2025
SPX · April 4, 2025

SPX — The Roadmap Before the April 2025 Low

This SPX daily Elliott Wave roadmap was published on April 4, 2025, while the market was still declining.

The wave count identified a major target and reversal zone around the 4,800 area. SPX ultimately reached 4,835.04 before beginning the next major advance.

This is how we use Elliott Wave: build the roadmap in advance, identify important price levels, and adjust the wave count as price confirms or rejects the roadmap.

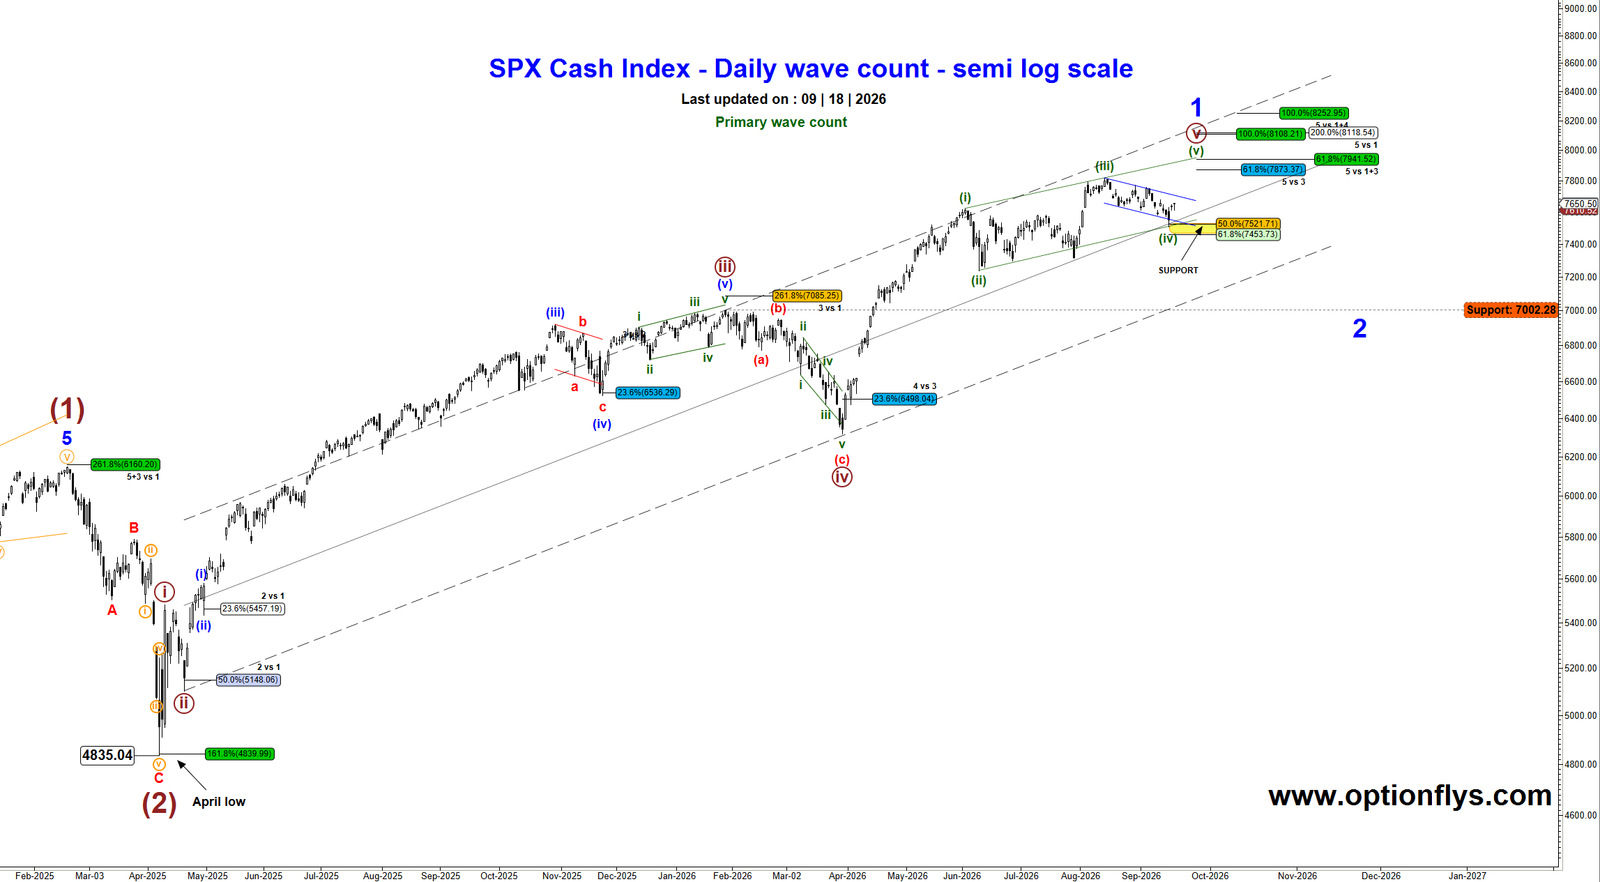
Updated SPX primary Elliott Wave count from the April 2025 low through September 2026
SPX · September 2026 Update

SPX — From the April Low to September 2026

The updated primary SPX wave count shows how the waves developed after the 4,835.04 April 2025 low.

Rather than changing the entire roadmap around every short-term market move, we maintain the larger-degree wave count and adjust the smaller-degree waves as price develops.

No prediction. No attachment to a count. Price decides.